TEST, ODI & T20 STATISTICS
Bowling Records
Leading wicket takers across recorded matches. Choose a format to compare bowling totals.
MDM figures reflect the available Cricsheet deliveries. Mixed men’s and women’s competitions are included. A player with missing earlier matches can appear below a player with more complete coverage. Super overs are excluded.
| # | Player | Matches | Runs | Wickets | 100s | 50s | Ducks | High |
|---|---|---|---|---|---|---|---|---|
| 1 | Jamie Porter | 145 | 613 | 551 | 0 | 1 | 29 | 52 |
| 2 | 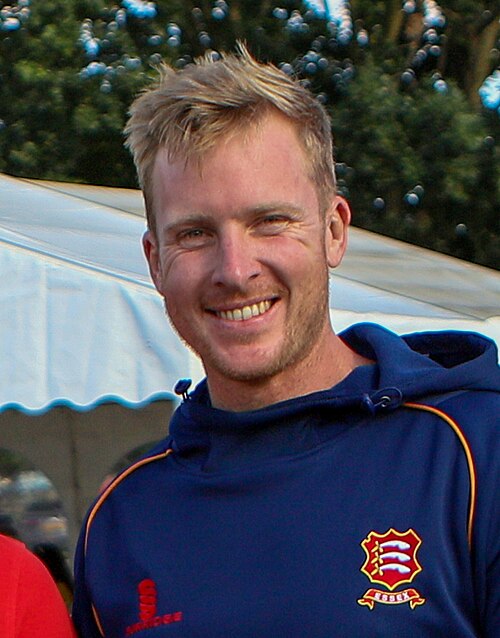 Simon Harmer | 123 | 3,341 | 538 | 0 | 18 | 27 | 83 |
| 3 | Kyle Abbott | 125 | 2,245 | 523 | 0 | 8 | 23 | 97 |
| 4 | Chris Rushworth | 127 | 1,310 | 518 | 0 | 1 | 24 | 57 |
| 5 | Ben Raine | 144 | 4,290 | 511 | 3 | 18 | 18 | 106 |
| 6 | 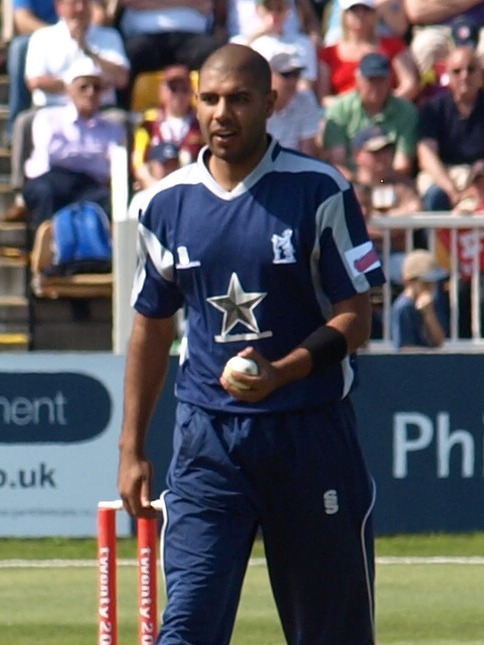 Jeetan Patel | 128 | 3,466 | 476 | 2 | 12 | 24 | 105 |
| 7 | Toby Roland-Jones | 127 | 3,429 | 453 | 1 | 14 | 16 | 103 |
| 8 | 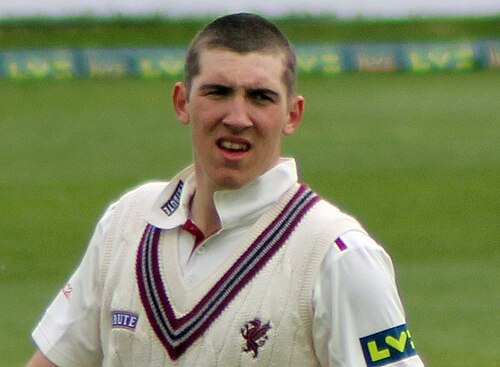 Craig Overton | 127 | 4,091 | 451 | 4 | 20 | 19 | 141 |
| 9 | Ben Sanderson | 117 | 1,280 | 450 | 0 | 1 | 30 | 65 |
| 10 | Tom Bailey | 123 | 2,661 | 431 | 0 | 10 | 19 | 78 |
| 11 | Joe Leach | 118 | 3,184 | 430 | 0 | 18 | 16 | 95 |
| 12 | Tim Murtagh | 105 | 1,210 | 412 | 0 | 0 | 32 | 47 |
| 13 | Keith Barker | 120 | 4,216 | 397 | 3 | 24 | 20 | 113 |
| 14 | Ollie Robinson | 91 | 2,345 | 395 | 2 | 7 | 13 | 110 |
| 15 | 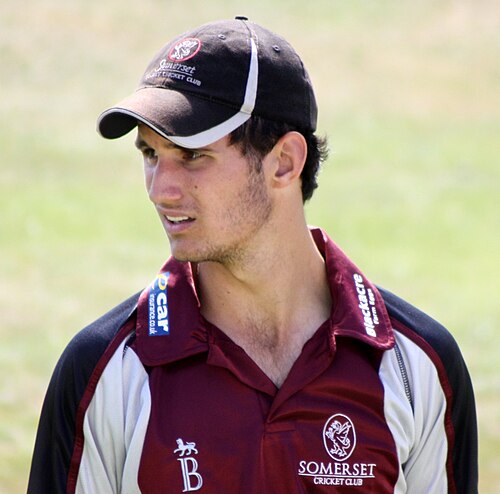 Lewis Gregory | 122 | 4,370 | 387 | 4 | 22 | 18 | 137 |
| 16 | Ryan Higgins | 116 | 5,892 | 374 | 14 | 23 | 17 | 221 |
| 17 | Jack Leach | 110 | 1,523 | 368 | 0 | 2 | 17 | 66 |
| 18 | Brett Hutton | 105 | 2,296 | 362 | 0 | 8 | 23 | 84 |
| 19 | Oliver Hannon-Dalby | 114 | 673 | 353 | 0 | 0 | 22 | 40 |
| 20 | Ed Barnard | 142 | 6,511 | 348 | 11 | 35 | 19 | 177 |
| 21 | Michael Hogan | 105 | 1,209 | 348 | 0 | 1 | 16 | 54 |
| 22 | Sam Cook | 93 | 867 | 347 | 0 | 0 | 19 | 49 |
| 23 | Darren Stevens | 93 | 4,379 | 343 | 7 | 25 | 16 | 237 |
| 24 | Ben Coad | 88 | 1,255 | 338 | 0 | 2 | 16 | 89 |
| 25 | Ajaz Patel | 98 | 1,942 | 336 | 0 | 6 | 16 | 62 |
| 26 | 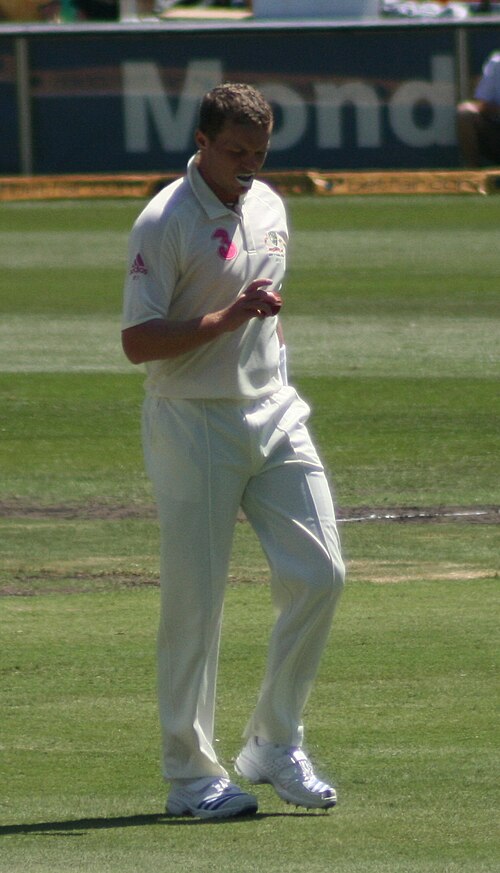 Peter Siddle | 89 | 1,573 | 332 | 0 | 2 | 16 | 89 |
| 27 | Jack Brooks | 92 | 1,467 | 332 | 1 | 3 | 12 | 109 |
| 28 | James Harris | 107 | 2,718 | 329 | 0 | 12 | 22 | 80 |
| 29 | Chris Wright | 113 | 2,670 | 328 | 0 | 10 | 21 | 87 |
| 30 | Neil Wagner | 86 | 1,749 | 322 | 0 | 5 | 19 | 72 |
| 31 | Timm van der Gugten | 101 | 2,210 | 316 | 0 | 11 | 18 | 85 |
| 32 | 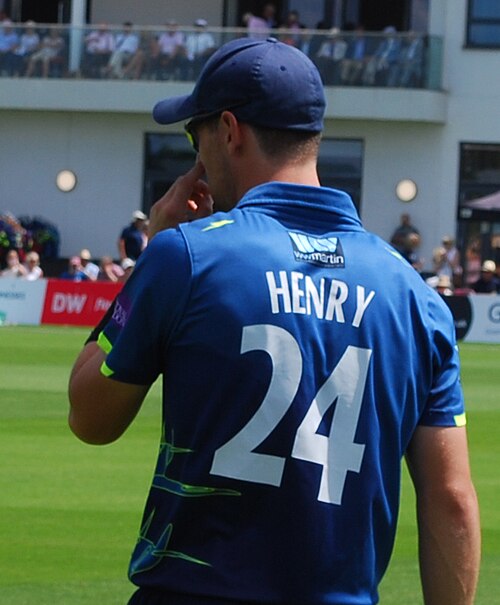 Matt Henry | 62 | 1,437 | 305 | 0 | 3 | 10 | 75 |
| 33 | Ethan Bamber | 88 | 1,136 | 303 | 1 | 0 | 20 | 107 |
| 34 | Scott Kuggeleijn | 87 | 3,261 | 298 | 3 | 18 | 15 | 142 |
| 35 | Daniel Worrall | 77 | 1,058 | 297 | 0 | 2 | 19 | 51 |
| 36 | Jacob Duffy | 93 | 1,359 | 295 | 0 | 3 | 22 | 71 |
| 37 | Mohammad Abbas | 78 | 239 | 295 | 0 | 0 | 19 | 32 |
| 38 | Craig Miles | 89 | 1,531 | 292 | 0 | 3 | 20 | 62 |
| 39 | Liam Dawson | 126 | 6,237 | 285 | 12 | 28 | 10 | 171 |
| 40 | Tom Taylor | 93 | 2,462 | 283 | 0 | 11 | 16 | 80 |
| 41 | Michael Neser | 70 | 2,570 | 281 | 5 | 9 | 9 | 176 |
| 42 | Jordan Clark | 114 | 3,779 | 278 | 3 | 24 | 14 | 137 |
| 43 | Matthew Potts | 69 | 1,547 | 276 | 1 | 5 | 13 | 149 |
| 44 | Liam Norwell | 67 | 872 | 274 | 1 | 2 | 18 | 102 |
| 45 | Luke Fletcher | 86 | 1,245 | 271 | 0 | 3 | 19 | 51 |
| 46 | Logan van Beek | 89 | 2,572 | 269 | 2 | 11 | 10 | 111 |
| 47 | Steven Patterson | 101 | 1,641 | 267 | 0 | 3 | 16 | 63 |
| 48 | Nathan McAndrew | 63 | 1,911 | 257 | 0 | 9 | 6 | 65 |
| 49 | Doug Bracewell | 74 | 2,724 | 252 | 2 | 17 | 12 | 105 |
| 50 | Will Williams | 88 | 1,165 | 251 | 0 | 2 | 16 | 98 |
Source: Cricsheet · ODC-By 1.0 · Coverage & methodology. Results through 25 Oct 2026.