TEST, ODI & T20 STATISTICS
Maximum Ducks
Dismissals for zero across recorded innings. Retired hurt and retired not out are excluded.
MDM figures reflect the available Cricsheet deliveries. Mixed men’s and women’s competitions are included. A player with missing earlier matches can appear below a player with more complete coverage. Super overs are excluded.
| # | Player | Matches | Runs | Wickets | 100s | 50s | Ducks | High |
|---|---|---|---|---|---|---|---|---|
| 1 | Gareth Roderick | 132 | 6,125 | 0 | 8 | 35 | 36 | 172 |
| 2 | Tim Murtagh | 105 | 1,210 | 412 | 0 | 0 | 32 | 47 |
| 3 | Ben Brown | 163 | 9,049 | 0 | 21 | 42 | 30 | 165 |
| 4 | Ben Sanderson | 117 | 1,280 | 450 | 0 | 1 | 30 | 65 |
| 5 | 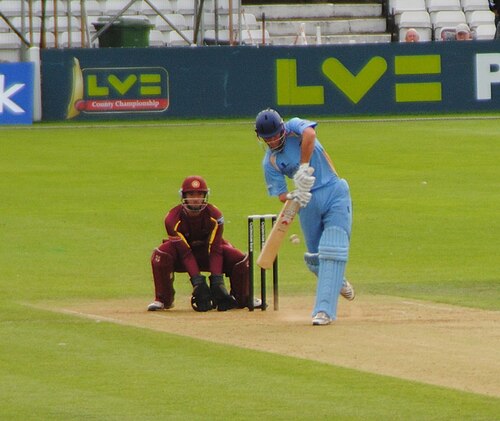 Wayne Madsen | 156 | 11,061 | 26 | 27 | 61 | 29 | 204 |
| 6 | 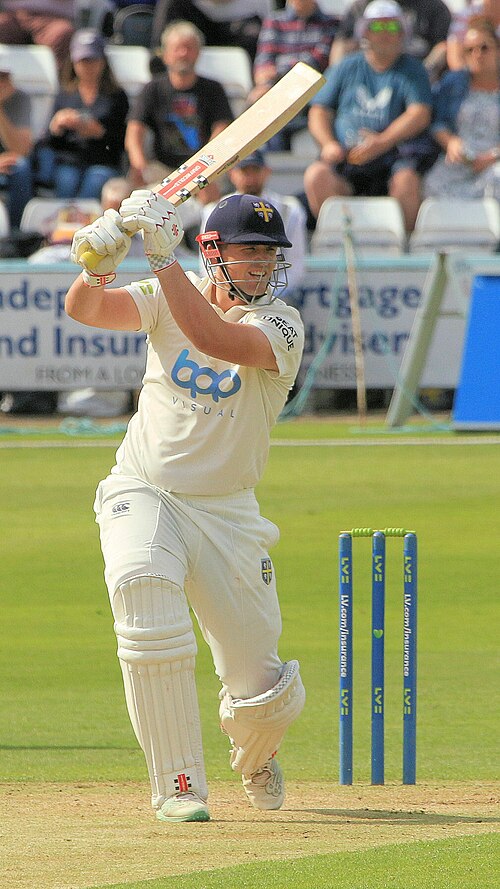 Alex Lees | 156 | 9,836 | 3 | 27 | 43 | 29 | 195 |
| 7 | Jamie Porter | 145 | 613 | 551 | 0 | 1 | 29 | 52 |
| 8 | Joe Clarke | 148 | 9,161 | 0 | 24 | 45 | 27 | 229 |
| 9 | Jack Leaning | 129 | 6,353 | 43 | 11 | 32 | 27 | 220 |
| 10 |  Simon Harmer | 123 | 3,341 | 538 | 0 | 18 | 27 | 83 |
| 11 | Kiran Carlson | 109 | 6,561 | 42 | 16 | 35 | 25 | 209 |
| 12 | Sam Robson | 155 | 9,036 | 20 | 23 | 37 | 24 | 253 |
| 13 | Alex Davies | 139 | 7,187 | 0 | 11 | 44 | 24 | 256 |
| 14 | 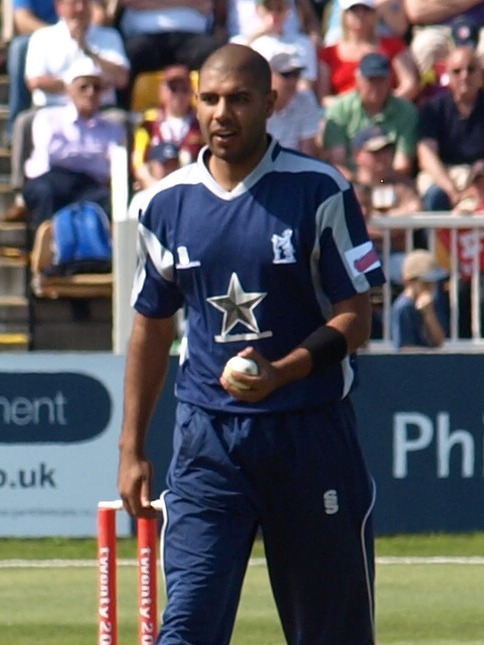 Jeetan Patel | 128 | 3,466 | 476 | 2 | 12 | 24 | 105 |
| 15 | Chris Rushworth | 127 | 1,310 | 518 | 0 | 1 | 24 | 57 |
| 16 | 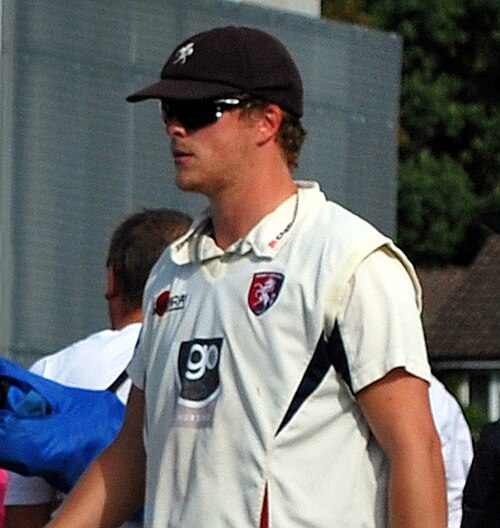 Sam Northeast | 156 | 10,389 | 0 | 29 | 42 | 23 | 410 |
| 17 | Haseeb Hameed | 133 | 8,257 | 1 | 20 | 42 | 23 | 247 |
| 18 | Brett Hutton | 105 | 2,296 | 362 | 0 | 8 | 23 | 84 |
| 19 | Kyle Abbott | 125 | 2,245 | 523 | 0 | 8 | 23 | 97 |
| 20 |  Adam Lyth | 163 | 10,320 | 39 | 28 | 49 | 22 | 230 |
| 21 | Keaton Jennings | 145 | 9,316 | 21 | 24 | 39 | 22 | 318 |
| 22 |  Tom Abell | 139 | 9,126 | 56 | 24 | 45 | 22 | 307 |
| 23 | Mark Stoneman | 142 | 8,461 | 1 | 19 | 39 | 22 | 197 |
| 24 |  Daniel Bell-Drummond | 149 | 8,395 | 23 | 17 | 39 | 22 | 300 |
| 25 |  Ben Cox | 146 | 6,199 | 0 | 5 | 34 | 22 | 162 |
| 26 | 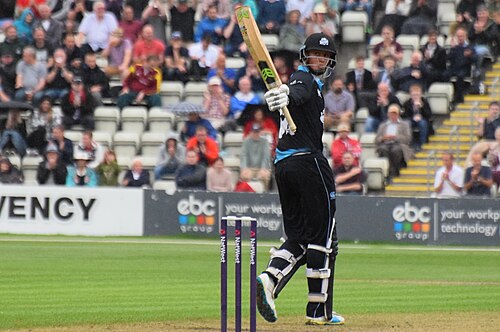 Tom Kohler-Cadmore | 103 | 5,224 | 0 | 13 | 21 | 22 | 169 |
| 27 | James Harris | 107 | 2,718 | 329 | 0 | 12 | 22 | 80 |
| 28 | Jacob Duffy | 93 | 1,359 | 295 | 0 | 3 | 22 | 71 |
| 29 | Oliver Hannon-Dalby | 114 | 673 | 353 | 0 | 0 | 22 | 40 |
| 30 | Luke Wells | 148 | 8,731 | 114 | 22 | 37 | 21 | 258 |
| 31 | Sean Dickson | 99 | 4,770 | 0 | 10 | 21 | 21 | 318 |
| 32 | Dominic Bess | 95 | 3,191 | 230 | 1 | 18 | 21 | 107 |
| 33 | Chris Wright | 113 | 2,670 | 328 | 0 | 10 | 21 | 87 |
| 34 | Matt Taylor | 94 | 1,389 | 249 | 0 | 2 | 21 | 57 |
| 35 | Michael Rae | 69 | 606 | 211 | 0 | 0 | 21 | 36 |
| 36 | Harry Gurney | 52 | 251 | 177 | 0 | 0 | 21 | 42 |
| 37 | Tom Westley | 160 | 8,880 | 22 | 21 | 36 | 20 | 254 |
| 38 | Nick Gubbins | 139 | 8,302 | 3 | 19 | 40 | 20 | 201 |
| 39 | Sam Hain | 141 | 8,147 | 0 | 18 | 45 | 20 | 208 |
| 40 | Chris Dent | 128 | 7,584 | 9 | 16 | 46 | 20 | 268 |
| 41 | James Bracey | 111 | 6,792 | 0 | 19 | 28 | 20 | 207 |
| 42 | Brett D'Oliveira | 129 | 6,370 | 68 | 11 | 32 | 20 | 202 |
| 43 | Daryl Mitchell | 100 | 5,733 | 12 | 20 | 18 | 20 | 206 |
| 44 | Keith Barker | 120 | 4,216 | 397 | 3 | 24 | 20 | 113 |
| 45 | Craig Miles | 89 | 1,531 | 292 | 0 | 3 | 20 | 62 |
| 46 | Ethan Bamber | 88 | 1,136 | 303 | 1 | 0 | 20 | 107 |
| 47 | Wes Agar | 45 | 743 | 142 | 0 | 2 | 20 | 57 |
| 48 | Matt Parkinson | 78 | 641 | 242 | 0 | 0 | 20 | 48 |
| 49 | Ben Slater | 144 | 8,820 | 3 | 15 | 47 | 19 | 225 |
| 50 | Cameron Bancroft | 125 | 7,923 | 2 | 20 | 35 | 19 | 206 |
Source: Cricsheet · ODC-By 1.0 · Coverage & methodology. Results through 25 Oct 2026.