TEST, ODI & T20 STATISTICS
Highest Scores
Each player’s highest recorded innings, ranked by runs. These figures cover the available scorebook, not every career innings.
MDM figures reflect the available Cricsheet deliveries. Mixed men’s and women’s competitions are included. A player with missing earlier matches can appear below a player with more complete coverage. Super overs are excluded.
| # | Player | Matches | Runs | Wickets | 100s | 50s | Ducks | High |
|---|---|---|---|---|---|---|---|---|
| 1 | 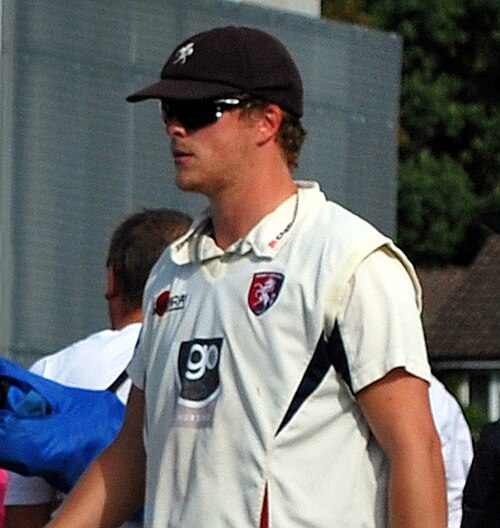 Sam Northeast | 156 | 10,389 | 0 | 29 | 42 | 23 | 410 |
| 2 | Tom Banton | 49 | 2,616 | 0 | 4 | 13 | 5 | 371 |
| 3 | Tom Bruce | 89 | 5,968 | 20 | 11 | 33 | 11 | 345 |
| 4 | Dean Brownlie | 47 | 3,305 | 0 | 8 | 19 | 3 | 334 |
| 5 | Devon Conway | 25 | 2,239 | 0 | 5 | 8 | 2 | 327 |
| 6 | Keaton Jennings | 145 | 9,316 | 21 | 24 | 39 | 22 | 318 |
| 7 | Sean Dickson | 99 | 4,770 | 0 | 10 | 21 | 21 | 318 |
| 8 | Michael Papps | 48 | 3,704 | 0 | 10 | 13 | 3 | 316 |
| 9 | David Lloyd | 112 | 5,229 | 100 | 5 | 25 | 16 | 313 |
| 10 | 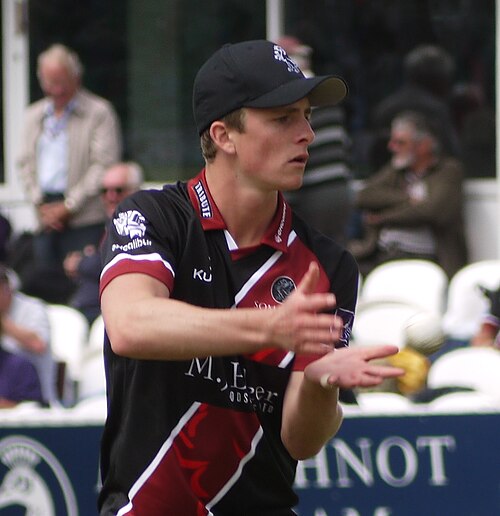 Tom Abell | 139 | 9,126 | 56 | 24 | 45 | 22 | 307 |
| 11 | Dominic Sibley | 131 | 8,157 | 3 | 21 | 43 | 13 | 305 |
| 12 | 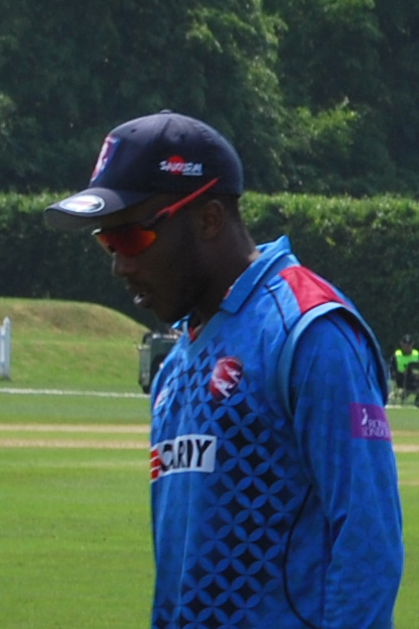 Daniel Bell-Drummond | 149 | 8,395 | 23 | 17 | 39 | 22 | 300 |
| 13 | James Taylor | 25 | 1,794 | 0 | 3 | 11 | 5 | 291 |
| 14 | James Wharton | 44 | 2,436 | 1 | 2 | 16 | 6 | 285 |
| 15 | 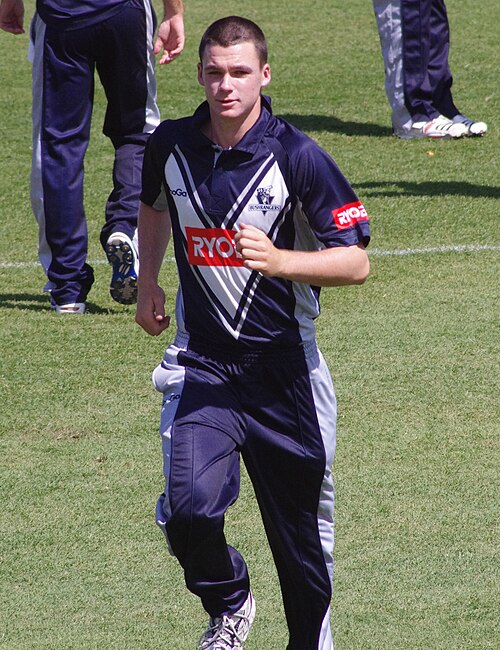 Peter Handscomb | 121 | 7,490 | 0 | 16 | 42 | 17 | 281 |
| 16 | 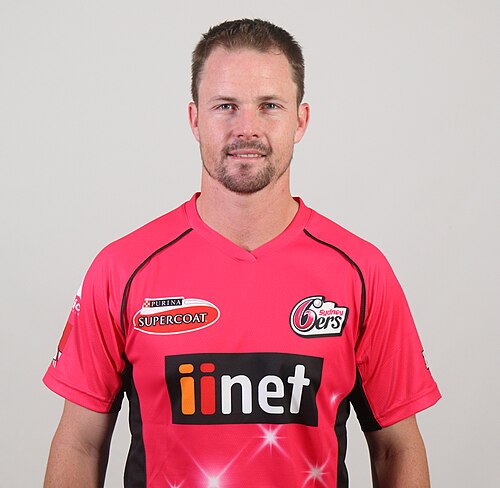 Colin Munro | 30 | 2,881 | 25 | 12 | 9 | 1 | 281 |
| 17 | David Bedingham | 72 | 5,658 | 0 | 21 | 17 | 4 | 279 |
| 18 | Colin Ackermann | 100 | 5,817 | 60 | 13 | 30 | 15 | 277 |
| 19 | Mark Chapman | 39 | 2,767 | 1 | 6 | 15 | 1 | 276 |
| 20 | Ollie Pope | 66 | 4,582 | 0 | 14 | 17 | 5 | 274 |
| 21 | Tom Cooper | 27 | 1,323 | 6 | 2 | 5 | 6 | 271 |
| 22 | Chris Dent | 128 | 7,584 | 9 | 16 | 46 | 20 | 268 |
| 23 | Dane Vilas | 80 | 4,118 | 0 | 10 | 16 | 12 | 266 |
| 24 | Adam Hose | 61 | 2,990 | 0 | 3 | 16 | 9 | 266 |
| 25 | Leus du Plooy | 93 | 6,115 | 11 | 16 | 29 | 12 | 263 |
| 26 | Luke Procter | 130 | 6,984 | 155 | 10 | 41 | 15 | 261 |
| 27 | Emilio Gay | 70 | 4,592 | 2 | 14 | 16 | 14 | 261 |
| 28 | Tom Latham | 57 | 4,591 | 0 | 12 | 27 | 5 | 261 |
| 29 | Lahiru Udara | 18 | 1,673 | 2 | 6 | 5 | 1 | 261 |
| 30 | 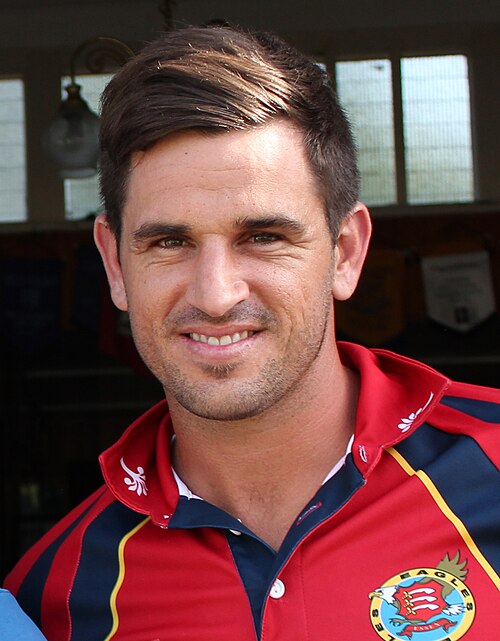 Ryan ten Doeschate | 85 | 4,857 | 43 | 11 | 24 | 6 | 259 |
| 31 | Luke Wells | 148 | 8,731 | 114 | 22 | 37 | 21 | 258 |
| 32 | Colin Ingram | 77 | 5,731 | 17 | 18 | 23 | 8 | 257 |
| 33 | 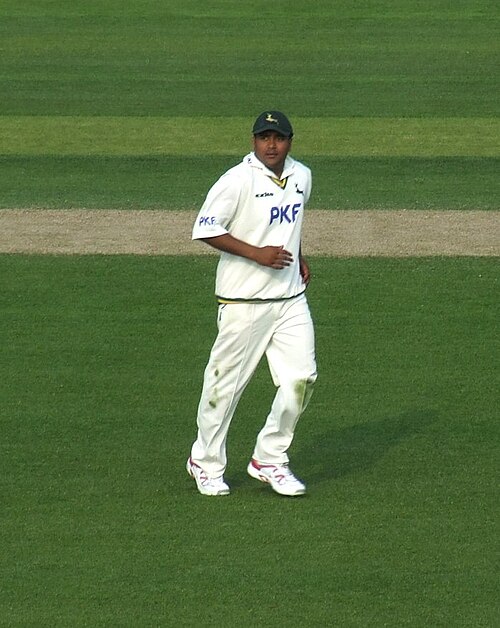 Samit Patel | 89 | 4,547 | 145 | 7 | 26 | 12 | 257 |
| 34 | Ashwell Prince | 25 | 1,667 | 0 | 4 | 6 | 2 | 257 |
| 35 | Alex Davies | 139 | 7,187 | 0 | 11 | 44 | 24 | 256 |
| 36 | Nick Browne | 125 | 6,847 | 0 | 16 | 27 | 14 | 255 |
| 37 | Will Pucovski | 19 | 1,224 | 0 | 4 | 5 | 4 | 255 |
| 38 | Tom Westley | 160 | 8,880 | 22 | 21 | 36 | 20 | 254 |
| 39 | Sam Robson | 155 | 9,036 | 20 | 23 | 37 | 24 | 253 |
| 40 | Ollie Price | 62 | 3,344 | 46 | 6 | 18 | 7 | 253 |
| 41 | Oliver Davies | 26 | 1,656 | 3 | 4 | 8 | 3 | 253 |
| 42 | Cameron Green | 25 | 2,394 | 14 | 10 | 6 | 1 | 251 |
| 43 | Ed Joyce | 40 | 3,304 | 0 | 11 | 12 | 5 | 250 |
| 44 | Haseeb Hameed | 133 | 8,257 | 1 | 20 | 42 | 23 | 247 |
| 45 | Alex Doolan | 19 | 1,282 | 0 | 2 | 7 | 5 | 247 |
| 46 | 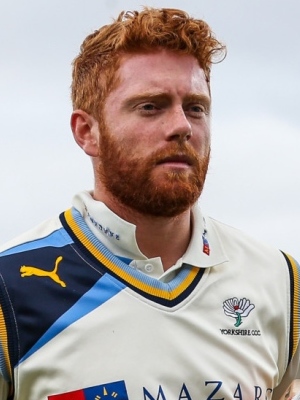 Jonny Bairstow | 62 | 4,063 | 0 | 10 | 21 | 8 | 246 |
| 47 | Ben Smith | 60 | 2,871 | 1 | 6 | 11 | 8 | 244 |
| 48 | BS McKinney | 30 | 1,838 | 1 | 6 | 3 | 4 | 244 |
| 49 | Ravindu Rasantha | 16 | 842 | 0 | 3 | 1 | 2 | 244 |
| 50 | Tom Haines | 96 | 5,872 | 38 | 14 | 27 | 13 | 243 |
Source: Cricsheet · ODC-By 1.0 · Coverage & methodology. Results through 25 Oct 2026.