TEST, ODI & T20 STATISTICS
Let the numbers do the talking.
Compare runs, wickets, centuries and highest scores across the matches in our scorebook. Select a format to explore the performances.
ODM figures reflect the available Cricsheet deliveries. Mixed men’s and women’s competitions are included. A player with missing earlier matches can appear below a player with more complete coverage. Super overs are excluded.
| # | Player | Matches | Runs | Wickets | 100s | 50s | Ducks | High |
|---|---|---|---|---|---|---|---|---|
| 1 | Tom Westley | 96 | 4,049 | 41 | 11 | 28 | 5 | 141 |
| 2 | Nick Gubbins | 91 | 3,759 | 14 | 8 | 24 | 4 | 144 |
| 3 | 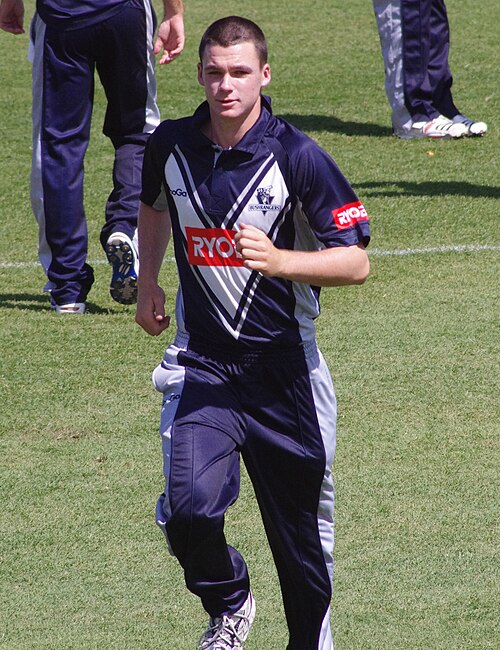 Peter Handscomb | 80 | 3,206 | 0 | 7 | 19 | 3 | 140 |
| 4 | 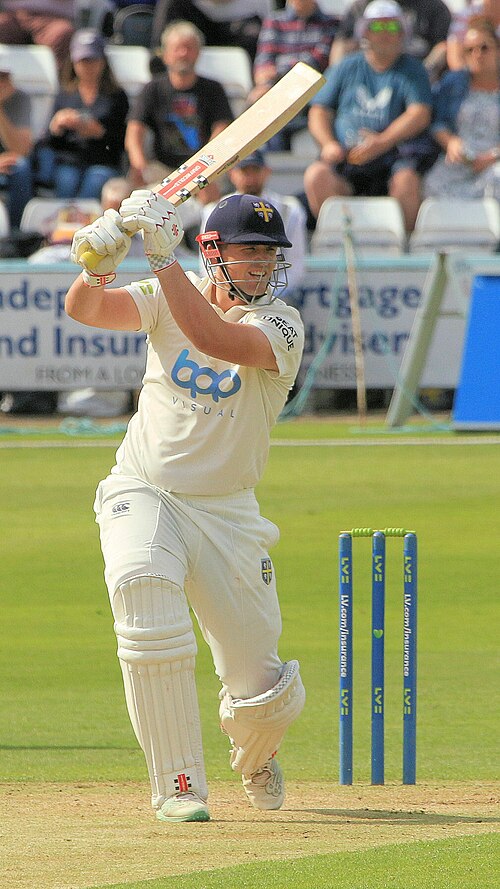 Alex Lees | 79 | 3,130 | 0 | 10 | 19 | 5 | 148 |
| 5 | Keaton Jennings | 78 | 3,129 | 8 | 9 | 15 | 4 | 156 |
| 6 | Ben Slater | 68 | 3,031 | 0 | 7 | 20 | 2 | 164 |
| 7 | Colin Ingram | 61 | 2,979 | 22 | 10 | 16 | 1 | 155 |
| 8 | Evelyn Jones | 71 | 2,973 | 4 | 6 | 21 | 6 | 136 |
| 9 | Georgia Adams | 75 | 2,789 | 103 | 5 | 20 | 4 | 154 |
| 10 | Hollie Armitage | 76 | 2,751 | 25 | 7 | 14 | 4 | 131 |
| 11 | 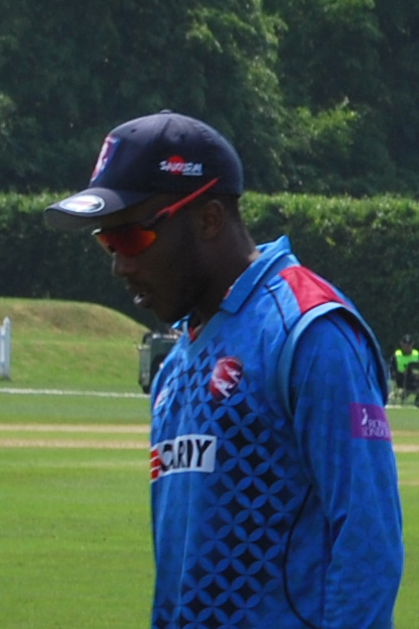 Daniel Bell-Drummond | 57 | 2,739 | 5 | 6 | 19 | 3 | 150 |
| 12 | Mark Stoneman | 78 | 2,710 | 1 | 4 | 18 | 5 | 144 |
| 13 | Jack Taylor | 91 | 2,678 | 48 | 3 | 21 | 4 | 139 |
| 14 | Sophie Luff | 69 | 2,667 | 1 | 6 | 19 | 2 | 157 |
| 15 | Cameron Bancroft | 76 | 2,648 | 0 | 5 | 14 | 7 | 151 |
| 16 | 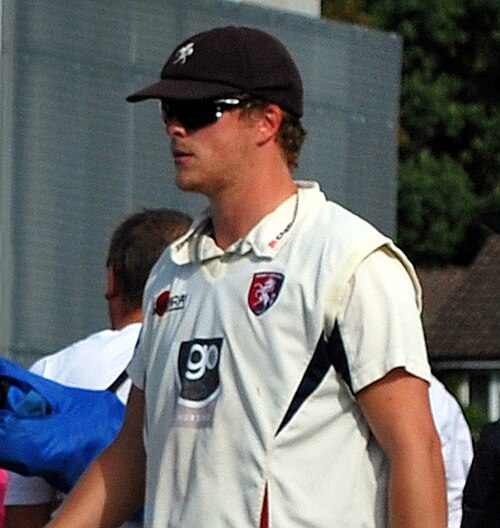 Sam Northeast | 72 | 2,634 | 0 | 4 | 19 | 2 | 177 |
| 17 | Jake Libby | 57 | 2,607 | 6 | 7 | 18 | 3 | 126 |
| 18 | Will Rhodes | 73 | 2,474 | 56 | 3 | 13 | 3 | 148 |
| 19 | Ed Barnard | 85 | 2,437 | 103 | 6 | 10 | 3 | 173 |
| 20 | Grace Scrivens | 75 | 2,415 | 38 | 4 | 17 | 4 | 120 |
| 21 |  Ben Cox | 91 | 2,411 | 0 | 1 | 15 | 2 | 122 |
| 22 | Georgia Elwiss | 67 | 2,401 | 43 | 4 | 18 | 4 | 134 |
| 23 | Billy Godleman | 53 | 2,381 | 0 | 7 | 11 | 1 | 137 |
| 24 | Kathryn Bryce | 72 | 2,371 | 92 | 5 | 15 | 5 | 162 |
| 25 | Alice Davidson-Richards | 73 | 2,319 | 50 | 3 | 18 | 3 | 107 |
| 26 | Harry Finch | 75 | 2,298 | 0 | 2 | 15 | 4 | 108 |
| 27 | James Bracey | 55 | 2,296 | 1 | 6 | 10 | 2 | 224 |
| 28 | Maia Bouchier | 57 | 2,210 | 2 | 4 | 15 | 1 | 143 |
| 29 | Lauren Winfield | 57 | 2,196 | 0 | 3 | 18 | 4 | 125 |
| 30 | Emma Lamb | 47 | 2,185 | 29 | 4 | 16 | 2 | 142 |
| 31 | Marcus Harris | 54 | 2,165 | 0 | 3 | 15 | 2 | 142 |
| 32 |  Wayne Madsen | 59 | 2,160 | 9 | 7 | 10 | 1 | 138 |
| 33 |  Adam Lyth | 64 | 2,106 | 10 | 4 | 9 | 3 | 144 |
| 34 | James Hildreth | 62 | 2,081 | 0 | 3 | 13 | 1 | 159 |
| 35 | Jack Leaning | 74 | 2,074 | 11 | 3 | 13 | 6 | 137 |
| 36 | Rory Burns | 75 | 2,064 | 0 | 0 | 13 | 3 | 95 |
| 37 | Haseeb Hameed | 63 | 2,050 | 0 | 4 | 15 | 4 | 114 |
| 38 | Ella McCaughan | 74 | 2,049 | 0 | 2 | 11 | 7 | 133 |
| 39 | Sterre Kalis | 74 | 2,044 | 0 | 1 | 14 | 8 | 100 |
| 40 | Varun Chopra | 40 | 2,026 | 0 | 6 | 9 | 2 | 160 |
| 41 | Peter Trego | 60 | 2,020 | 31 | 6 | 11 | 7 | 141 |
| 42 | Graham Clark | 58 | 2,013 | 4 | 4 | 11 | 4 | 141 |
| 43 | Sam Robson | 50 | 2,000 | 10 | 4 | 13 | 3 | 169 |
| 44 | Gareth Roderick | 69 | 1,970 | 0 | 5 | 9 | 3 | 152 |
| 45 | Ryan Patel | 46 | 1,968 | 16 | 5 | 13 | 2 | 131 |
| 46 | Caleb Jewell | 53 | 1,960 | 0 | 5 | 9 | 4 | 137 |
| 47 | Riki Wessels | 55 | 1,958 | 0 | 4 | 11 | 5 | 146 |
| 48 | Ben Foakes | 54 | 1,958 | 0 | 1 | 16 | 1 | 106 |
| 49 | Tom Alsop | 54 | 1,947 | 0 | 5 | 11 | 5 | 189 |
| 50 | Rob Keogh | 71 | 1,927 | 41 | 3 | 14 | 7 | 134 |
Source: Cricsheet · ODC-By 1.0 · Coverage & methodology. Results through 25 Oct 2026.