TEST, ODI & T20 STATISTICS
Let the numbers do the talking.
Compare runs, wickets, centuries and highest scores across the matches in our scorebook. Select a format to explore the performances.
Test figures reflect the available historical deliveries. Mixed men’s and women’s competitions are included. A player with missing earlier matches can appear below a player with more complete coverage. Super overs are excluded.
| # | Player | Matches | Runs | Wickets | 100s | 50s | Ducks | High |
|---|---|---|---|---|---|---|---|---|
| 1201 |  Mukesh Kumar | 3 | 0 | 7 | 0 | 0 | 1 | 0 |
| 1202 | Dilshan Madushanka | 1 | 0 | 0 | 0 | 0 | 1 | 0 |
| 1203 | 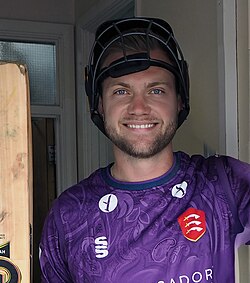 Sam Cook | 1 | 0 | 1 | 0 | 0 | 0 | 0 |
| 1204 | Anshul Kamboj | 1 | 0 | 1 | 0 | 0 | 1 | 0 |
| 1205 | Kundai Matigimu | 1 | 0 | 2 | 0 | 0 | 2 | 0 |
| 1206 | 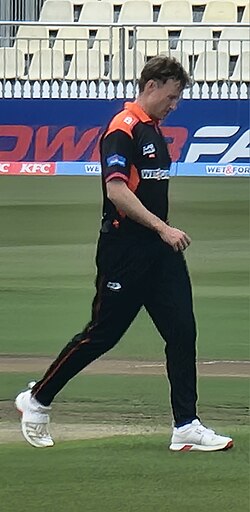 Matthew Fisher | 1 | 0 | 2 | 0 | 0 | 0 | 0 |
| 1207 | Ubaid Shah | 1 | 0 | 2 | 0 | 0 | 1 | 0 |
| 1208 | Anwar Hossain Monir | 1 | 0 | 0 | 0 | 0 | 1 | 0 |
| 1209 | 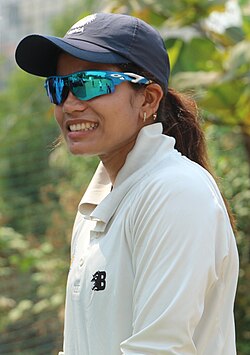 Nidhi Buley | 1 | 0 | 0 | 0 | 0 | 0 | 0 |
| 1210 | Sujeewa de Silva | 1 | 0 | 4 | 0 | 0 | 0 | 0 |
| 1211 | Emma Sampson | 1 | 0 | 3 | 0 | 0 | 0 | 0 |
| 1212 | Ishara Amerasinghe | 1 | 0 | 1 | 0 | 0 | 0 | 0 |
| 1213 | Amit Jaggernauth | 1 | 0 | 1 | 0 | 0 | 1 | 0 |
| 1214 | 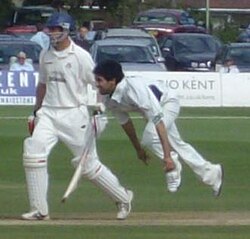 Amjad Khan | 1 | 0 | 1 | 0 | 0 | 0 | 0 |
| 1215 |  Holly Ferling | 2 | 0 | 2 | 0 | 0 | 0 | 0 |
| 1216 | Deep Dasgupta | 1 | 0 | 0 | 0 | 0 | 1 | 0 |
| 1217 | Mohammad Zahid | 1 | 0 | 2 | 0 | 0 | 2 | 0 |
| 1218 |  Charl Willoughby | 1 | 0 | 0 | 0 | 0 | 0 | 0 |
| 1219 | Ian Butler | 1 | 0 | 1 | 0 | 0 | 0 | 0 |
| 1220 | Terry McGregor | 1 | 0 | 0 | 0 | 0 | 0 | 0 |
| 1221 | Laura Harper | 1 | 0 | 1 | 0 | 0 | 1 | 0 |
| 1222 | Lucy Pearson | 1 | 0 | 11 | 0 | 0 | 1 | 0 |
| 1223 | Keon Peters | 1 | 0 | 2 | 0 | 0 | 1 | 0 |
| 1224 |  Ekta Bisht | 1 | 0 | 3 | 0 | 0 | 0 | 0 |
Available historical scorebook coverage through 25 Oct 2026. Our Sources & methodology →